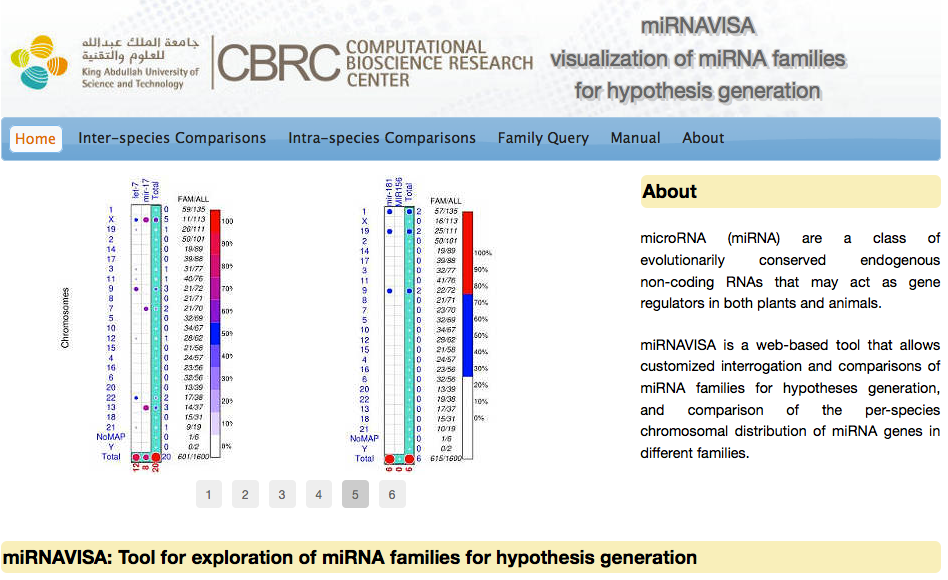
The term miRNAVISA derives from a concatenation of miRNA and VISA. The term VISA connotes both the "visualizations" of data to allow easy correlation of analyzed variables (species, chromosomes, miRNA families) and "entry" into the exciting miRNA world.
Often computational miRNA research tools and databases find prominent use in downstream analysis by other computational pipelines rather than by biologists. miRNAVISA is a web application that allows interrogation and comparisons of miRNA families for hypotheses generation, and comparison of the per-species chromosomal distribution of miRNA genes in different families. The design and implementation of the miRNAVISA system is targeted for use by both the biological and computational scientists more...
Follow the link to download the miRNAVISA users manual in PDF format.
linkVisit the following link for more details about the software http://www.cbrc.kaust.edu.sa/mirnavisa/index.php

Under this menu, the user can select a combination of two or more species together with at-least two families. The user can also opt to use the automated selection buttons for the popular (in terms of miRNA gene numbers) species vis-a-vis the largest miRNA families in the latest release of the miRBase database i.e., the central repository for miRNA research. In the example below, chicken (Gallus gallus) and mouse (Mus musculus) are selected with the combination of the miRNA families mir-515, mir- 548, mir-466 and mir-663. The user can select a species or miRNA family by clicking on the respective buttons with their names.
After submitting the query, the program generates graphical output in the Scalable Vector Graphic (SVG) format. Two buttons are provided for either download or display of the graph. By clicking on the "Download graph" button user can download a compressed SVG picture and by clicking on the "Display graph" the program opens a new window with the graph (see below) for perusal. The graph shows comparisons of miRNA gene distribution based on user input of miRNA families and species, relative to all other species in the miRBase database.
 Inter-species comparison
The results above imply that:
 Sample results given a miRNAVISA inter-species comparison query (four families).
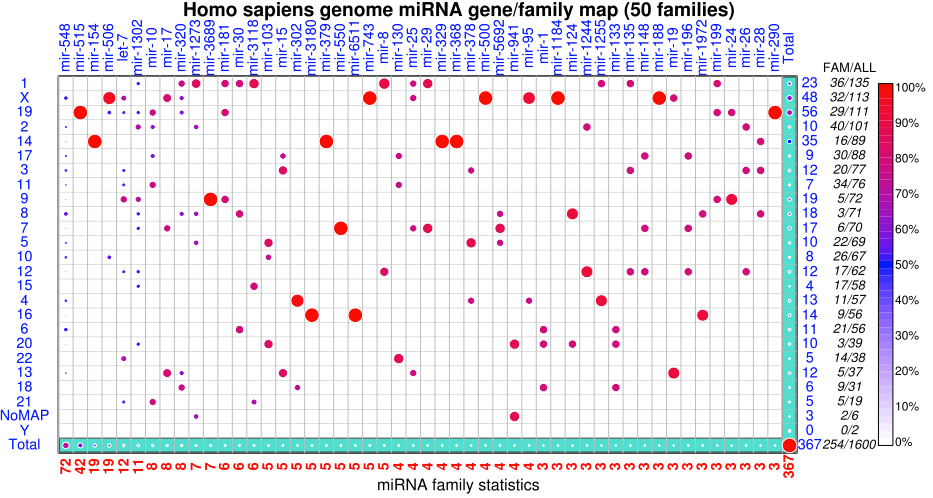
The Intra-species comparisons menu offers the same user interface as the inter-species comparison menu. However, the intra-species comparisons menu only allows the selection of one species and at-least two but no more than 50 miRNA families. The user can also opt to use the automated selection buttons for the human genome (default genome) to assess the distribution of miRNA genes belonging to the largest (top) miRNA families which are specific only to the selected genome. The graphical output, a genome miRNA genes/family map, shows the chromosomal distribution (rows) and per-family distribution (columns). The miRNA genes that are not mapped to any chromosome are reported under a predefined label 'Chunks/NoMap'. The figure below illustrates the genomic distribution of family-annotated miRNA genes in the human genome
 Sample results given a miRNAVISA intra-species comparison query. Genomic distribution of family-annotated human miRNA genes in the 50 largest miRNA families.
There are 1600 registered human miRNA genes in miRBase R19. About 61.2% (367 plus 612 genes) are classified into different miRNA families. The figure shows genome-wide distribution of miRNA genes in the 50 largest miRNA families. Moreover, it is apparent from the figure that:
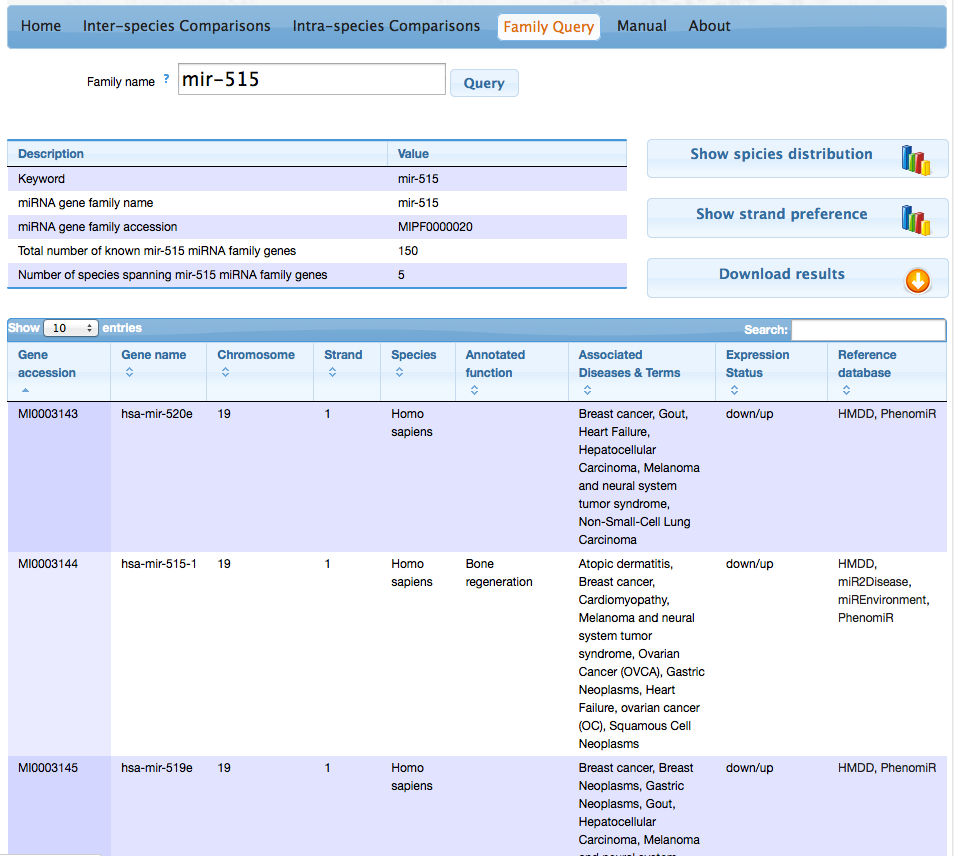
The Family Query menu allows a keyword search based on standard miRBase nomenclature for the names of miRNA, miRNA genes, and their families. The names/keywords are case insensitive and can include:
 Sample results a given miRNAVISA keyword or family query.
An error message is returned for unsuccessful keyword queries. The output of a successful miRNA family query includes:
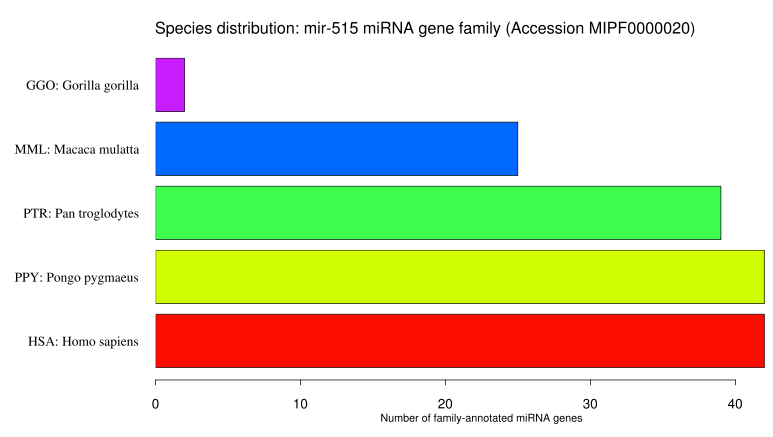
 Distribution of miRNA genes constituting the miRNA family "mir-515" in different species.
The figure above shows the distribution of miRNA genes with both known (mapped) and unknown (unmapped) chromosomal co-ordinates in each species. Figure 7 shows a comparison of the DNA strand preferences of mapped miRNA genes on the right panel. The number of miRNA genes that have been mapped on the positive (+1; FWD) strand and negative (-1; REV) strand are shown in red and blue bars, respectively. The number of unmapped miRNA genes in each species is reported on the left panel (green bars) in the figure below.
 Strand preferences miRNA genes constituting the "mir-515" miRNA gene family. The right panel shows the DNA strand preferences and number of mapped miRNA genes in different species. The left panel shows the number of miRNA family "mir-515" genes with unknown chromosomal co-ordinates in each species.
The blue bars in the above figure are explained in the manuscript along with the inference that the miRNA family mir-515 are preferentially transcribed from the +1 DNA strand. All the miRNA families mir-515 genes have only been reported in primate species (Figure 6). The user can download all the results of a query for their own use. These results are packaged in one archive file. All the graphs are in the Scalable Vector Graphs (SVG) file format and the tables are "tab separated" files that can easily be imported into any spreadsheet programs.